Using the DataDisplay: Difference between revisions
No edit summary |
No edit summary |
||
| Line 16: | Line 16: | ||
:{{GUIFIELD|Rec}}: Activates the recording feature. On the first press, a dialog is opened which allows to select a data file name. Henceforth, all data which are recorded by the DataDisplay are immediately stored into the specified data file. The data are stored into the file for as long as the recording feature is activated. It is deactivated by pressing this button again. | :{{GUIFIELD|Rec}}: Activates the recording feature. On the first press, a dialog is opened which allows to select a data file name. Henceforth, all data which are recorded by the DataDisplay are immediately stored into the specified data file. The data are stored into the file for as long as the recording feature is activated. It is deactivated by pressing this button again. | ||
'''5. Gravity Vector Plot''': This plot displays the estimated gravity vector. | '''5. Gravity Vector Plot''': This plot displays the estimated gravity vector, as well as the magnitude of the acceleration and the confidence level with which the accelerometer data is fused with the gyro data. | ||
'''6. Input Values''': These numbers represent the input values (see [[Inputs and Functions]]) received by the functions Rc Pitch, Rc Roll, Rc Yaw, Pan Mode Control, StandBy, Re-center Camera, Camera Control, Camera Control2, Script1 Control (from top to bottom). | '''6. Input Values''': These numbers represent the input values (see [[Inputs and Functions]]) received by the functions Rc Pitch, Rc Roll, Rc Yaw, Pan Mode Control, StandBy, Re-center Camera, Camera Control, Camera Control2, Script1 Control (from top to bottom). | ||
Revision as of 13:16, 13 January 2023
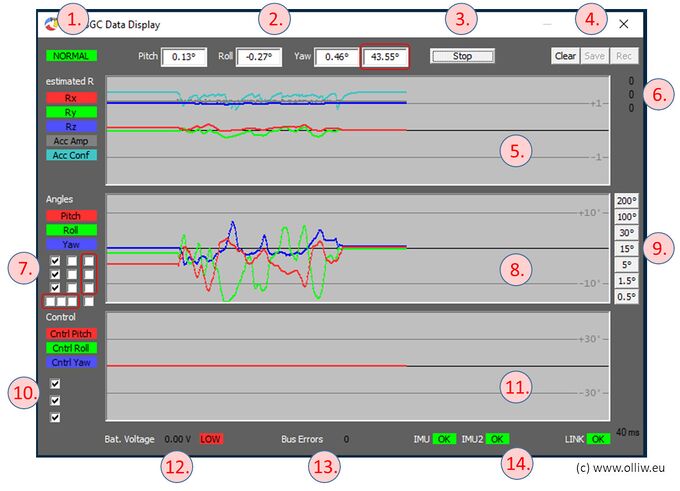
In combination with the [GUI:DashBoard], the [GUI:DataDisplay] is the main tool offered by the GUI for diagnosis and trouble shooting. It is also indispensable for tuning the gimbal.
1. State Field: Shows the current state of the controller. The possible states are described in Getting Started: First Startup.
2. Camera Angles: These fields show the current camera angles, as measured by Imu1, in units of degree.
3. Start/Stop: With this button the recording of the data is started and stopped.
4. Control Buttons:
- [Clear]: Clears the internal data buffer and resets the DataDisplay.
- [Save]: Allows to store the data which is in the data buffer into a file. The data buffer is a bit larger than for the data shown in the DataDisplay.
- [Rec]: Activates the recording feature. On the first press, a dialog is opened which allows to select a data file name. Henceforth, all data which are recorded by the DataDisplay are immediately stored into the specified data file. The data are stored into the file for as long as the recording feature is activated. It is deactivated by pressing this button again.
5. Gravity Vector Plot: This plot displays the estimated gravity vector, as well as the magnitude of the acceleration and the confidence level with which the accelerometer data is fused with the gyro data.
6. Input Values: These numbers represent the input values (see Inputs and Functions) received by the functions Rc Pitch, Rc Roll, Rc Yaw, Pan Mode Control, StandBy, Re-center Camera, Camera Control, Camera Control2, Script1 Control (from top to bottom).
7. Angle Selector: With these checkboxes it is selected which values are shown in the angle plot. The checkboxes to the left refer to (from top to bottom): Imu1 Pitch Angle, Imu1 Roll Angle, Imu1 Yaw Angle. Next to them are the checkboxes to select (from top to bottom): Imu2 Pitch Angle, Imu2 Roll Angle, Imu2 Yaw Angle. The additional checkbox in the third (right) column yields a white line, which shows the CPU time spend in one cycle (10 = 1000 us, 15 = 1500 us = cycle time).
Comment: In T-STorM32 mode the right column has four checkboxes; the first three refer to the encoder angles and the fourth to the CPU time.
8. Angle Plot: This plot displays the angles as selected by the angle selector. The plot can be changed in size by changing the size of the [GUI:DataDisplay] window. Also the plot can be shifted up and down by moving the mouse cursor while pressing the left mouse button. The plot can be recentered vertically by pressing the right mouse button.
9. Zoom Buttons: With these buttons the displayed angle range is chosen.
10. Control Output Selector: With these checkboxes it is selected which axes are shown in the control output plot.
11. Control Output Plot: This plot displays the output of the PID controller, before the 2nd Imu corrections are applied (compare with NT Data Logging: Logged Data).
12. Battery Status: Shows the current battery voltage, and status.
13. Bus Error Status: Shows the current error count, since start of the gimbal controller.
14. Sensor Status: Shows the health status of Imu1 and Imu2, and of the STorM32-Link.
Comment: In T-STorM32 mode the health status of the encoders is shown instead of Imu2.
